Earned value calculator
Four numbers in, the full earned value picture out: planned value, earned value, cost and schedule variance, CPI and SPI, three standard estimate-at-completion formulas side by side, estimate to complete, variance at completion and TCPI, with the math written out.
Sample inputs (illustrative): a $2,000,000 budget, 50% planned and 40% earned by the status date, $900,000 actual cost.
Prefer a spreadsheet? Get the free job cost report template for Excel
How this is calculated
Earned value management compares three numbers at one status date: what the plan said the work done by now would cost (planned value), what the work actually done was budgeted to cost (earned value), and what it actually cost (actual cost). Everything else is arithmetic on those three and the budget. The calculator uses the standard definitions from the PMI PMBOK Guide and the ANSI/EIA-748 earned value standard, the same ones the GAO Cost Estimating and Assessment Guide uses.
PV  = BAC × planned %            (budgeted cost of work scheduled, BCWS)
EV  = BAC × earned %             (budgeted cost of work performed, BCWP)
AC  = actual cost to date        (actual cost of work performed, ACWP)

CV  = EV − AC      CV% = CV ÷ EV       CPI = EV ÷ AC
SV  = EV − PV      SV% = SV ÷ PV       SPI = EV ÷ PV

EAC = BAC ÷ CPI                        cost performance continues
EAC = AC + (BAC − EV)                  remaining work at budget
EAC = AC + (BAC − EV) ÷ (CPI × SPI)    cost and schedule performance continue

ETC = EAC − AC     VAC = BAC − EAC
TCPI (to BAC) = (BAC − EV) ÷ (BAC − AC)     TCPI (to EAC) = (BAC − EV) ÷ (EAC − AC)
Earned value example: the sample job
The sample loaded above is a job with a $2,000,000 budget at completion. By the status date the baseline planned 50% of the work; the crew has completed 40%, and job cost shows $900,000 spent.
| Measure | Calculation | Result |
|---|---|---|
| Planned value | $2,000,000 × 50% | $1,000,000 |
| Earned value | $2,000,000 × 40% | $800,000 |
| Cost variance | $800,000 − $900,000 | −$100,000 |
| Schedule variance | $800,000 − $1,000,000 | −$200,000 |
| CPI | $800,000 ÷ $900,000 | 0.89 |
| SPI | $800,000 ÷ $1,000,000 | 0.80 |
| EAC, BAC ÷ CPI | $2,000,000 ÷ 0.8889 | $2,250,000 |
| EAC, AC + (BAC − EV) | $900,000 + $1,200,000 | $2,100,000 |
| EAC, CPI × SPI | $900,000 + $1,200,000 ÷ 0.7111 | $2,587,500 |
| ETC and VAC (BAC ÷ CPI) | $2,250,000 − $900,000; $2,000,000 − $2,250,000 | $1,350,000; −$250,000 |
| TCPI to BAC | $1,200,000 ÷ $1,100,000 | 1.09 |
Read together: the job is behind (SPI 0.80, $200,000 of planned work not yet done) and over cost for the work in place (CPI 0.89, $100,000 more spent than earned). If cost performance holds, it finishes at $2,250,000, $250,000 over budget. If the schedule slip also keeps costing money, the composite formula says $2,587,500. To land on the original budget, the remaining $1,200,000 of work would have to be done for $1,100,000: a TCPI of 1.09 against a CPI to date of 0.89. That gap is the conversation to have before the forecast goes to the owner or the WIP schedule.
Getting the three inputs right
- Earned percent complete must be physical. Use installed quantities, completed activities, or the rules of an earned value technique such as 0/100, 50/50 or weighted milestones. Cost ÷ budget makes EV equal AC and CPI meaningless.
- Planned percent comes from a baseline, not the current schedule. If the plan is re-drawn every month, SV and SPI always look fine. See schedule baseline.
- Actual cost must match the same scope and date. Include accrued cost for work in place but not yet invoiced, and leave out material bought for work not started, or CPI swings month to month.
- Measure at the level you manage. A job-level CPI can hide one bad control account behind several good ones. Run the calculator per cost code or WBS element when one area is in trouble.
What earned value does not tell you
SPI is measured in dollars, not days. It drifts back to 1.00 as a job nears completion even if the job finishes late, and it cannot tell you whether the work that slipped is on the critical path. Use the schedule, or SPI(t), for time. And no index forecast replaces a bottom-up cost-to-complete: the formulas show where the trend points, the project team says what will actually change.
Related: the estimate at completion calculator compares these methods with a PM forecast, a weighted index and a sensitivity grid; the critical path calculator covers the time side. See earned value, step by step for PV, EV and AC drawn as S-curves with a movable status date. Read construction cost reporting explained for how EAC flows into the cost report and the WIP, and how to write a monthly schedule narrative to explain the variances. Keep the numbers in the free job cost report template. In the glossary: estimate at completion, percent complete, performance factor and earned value technique.
Watch the explainer · 2:02
Earned value explained: PV, EV, AC, CPI and SPI
- 0:00Three numbers, one status date
- 0:20Planned value
- 0:38Earned value and actual cost
- 0:57Variances, CPI and SPI
- 1:20Forecast the finish
- 1:39Earned value in os.construction
Read the transcript
Earned value compares three numbers at the same status date: what you planned to do, what you actually did, and what it cost. Spending against the budget alone can't tell you whether a job is under budget or just behind. Earned value can, because it measures progress in budget dollars.
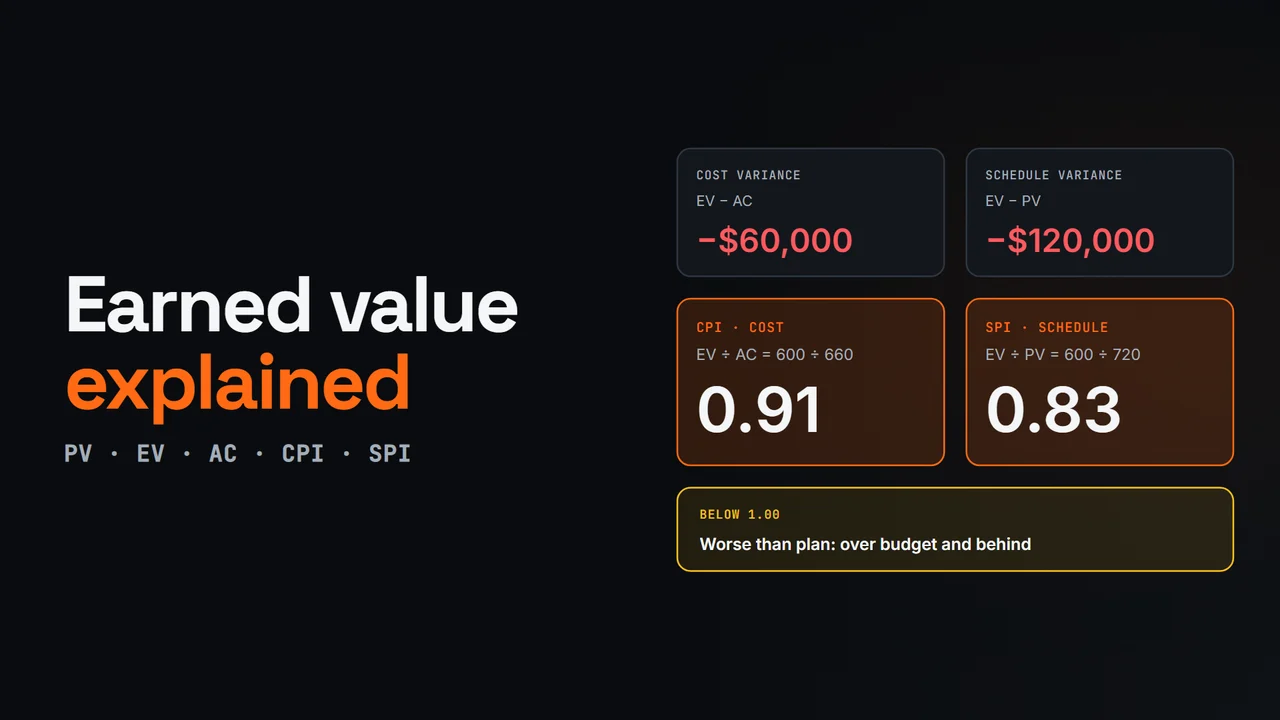
Start with the budget at completion. Take an illustrative control account with a budget of one point two million dollars, spread over a ten month baseline schedule. Planned value is the budget for the work scheduled by each date. At the end of month six, planned value is seven hundred twenty thousand dollars.
Earned value is the budget for the work actually done. The team has completed half the scope, so earned value is fifty percent of one point two million: six hundred thousand dollars. Actual cost is what that work really cost, from job cost with accruals: six hundred sixty thousand dollars.
Now read the gaps. Cost variance is earned value minus actual cost: minus sixty thousand, so the work cost more than its budget. Schedule variance is earned value minus planned value: minus one hundred twenty thousand. As ratios, CPI is zero point nine one and SPI is zero point eight three. Below one is worse than plan.
If cost efficiency stays where it is, the estimate at completion is the budget divided by CPI: one point three two million dollars, one hundred twenty thousand over budget. One caution: SPI is a ratio of money, not time. It drifts back to one as the job finishes, so don't read it as a finish date.
In os.construction Scheduling, the Planner shows earned value for each activity against the project baseline, with variances, CPI, SPI and the estimate at completion. Storing period performance keeps each period's figures as a permanent record.
Video page with chaptersMore in Construction concepts explained
How to calculate earned value with this calculator
- Enter the budget at completion. Enter BAC: the total budgeted cost of the work you are measuring, a whole job or one control account, including approved changes.
- Enter planned percent complete. From the baseline schedule, enter how much of the work should be done by the status date. That sets planned value (PV).
- Enter earned percent complete. Enter how much of the work is actually done, measured physically: installed quantities, weighted milestones or completed activities. That sets earned value (EV).
- Enter actual cost. Enter the actual cost recorded for that work to the same status date (AC), from job cost, including accruals for work in place.
- Read variances, indices and forecasts. Read CV, SV, CPI and SPI, compare the three EAC formulas, pick the one you believe, and check TCPI to see what the remaining work would have to achieve.
Earned value questions
How do you calculate earned value?
Earned value (EV) is the budgeted cost of the work actually performed: EV = budget at completion × earned percent complete. On a $2,000,000 budget that is 40% complete, EV is $800,000, whatever has actually been spent. Planned value is the same budget times the percent the schedule planned by the status date, and actual cost is what the work really cost.
What do CPI and SPI tell you?
CPI = EV ÷ AC is cost efficiency: 0.89 means you get 89 cents of budgeted work for every dollar spent. SPI = EV ÷ PV is schedule efficiency in money terms: 0.80 means 80% of the work planned by now is done. Above 1 is better than plan, below 1 is worse. SPI always returns to 1 at completion, because all planned work is eventually earned, so late in a job it says little; that is why some schedulers use SPI(t), a time-based version.
Which EAC formula should I use?
Each one answers a different question. BAC ÷ CPI assumes the cost efficiency so far continues. AC + (BAC − EV) assumes the remaining work goes exactly to budget, which is only reasonable if the overrun had a one-off cause. AC + (BAC − EV) ÷ (CPI × SPI) assumes cost and schedule performance both carry on, and usually gives the highest number when both indices are below 1. A bottom-up estimate to complete from the project team should be checked against all three.
What is TCPI and what is a good value?
The to-complete performance index is the cost efficiency the remaining work must achieve to hit a target: (BAC − EV) ÷ (BAC − AC) to finish on the original budget. Compare it with the CPI to date. If TCPI is well above CPI, finishing on budget needs the crew to perform much better than it has so far, which is a reason to re-forecast rather than a target to announce.
Why is my CPI exactly 1.00?
Usually because percent complete was calculated as cost spent ÷ budget. Then EV = AC by definition and CPI is always 1, which hides every overrun. Earned value only works when percent complete comes from physical progress, such as installed quantities, completed activities or weighted milestones, and actual cost comes separately from job cost.
Sources
Checked Nov 18, 2026. Formulas are the standard earned value relationships. The sample job is illustrative; none of its numbers are benchmarks.
- Cost Estimating and Assessment Guide (GAO-20-195G), U.S. Government Accountability Office (Mar 12, 2020).Used for: earned value definitions (PV, EV, AC, CV, SV, CPI, SPI), index-based EAC formulas including CPI × SPI, and comparing TCPI with CPI to test whether an EAC is realistic.
When the spreadsheet version stops scaling
Earned value from the schedule itself, not a side spreadsheet.
This calculator works on totals you type in. In os.construction Scheduling, earned value is worked out per activity from the schedule's own resource assignments, against the project baseline.
- Earned value columns in the Planner: BAC, planned value, earned value, actual cost, CV, SV, CPI, SPI and EAC (live).
- P6-style earned value and ETC techniques, set for the project or per WBS element (live).
- Store Period Performance keeps each financial period’s actuals, earned value and planned value as an immutable record (live).
Period performance and earned value docs Schedule in Projects
Stop re-keying the numbers behind this math.
Project Financials tracks job costs and billing. The Accounting module includes reviewed WIP snapshots, posting and close. Learn the apps and review historical source coverage before a cutover.
Email gets you product updates: what shipped and what's next. Start a free trial → Founding program →
You're subscribed.
We'll email you when something ships. The live tools are open now: start a 14-day free trial →
Want a say in what ships? Finish your founding application (2 min) →