Earned value, step by step
Three S-curves and a status date. Build planned value, earned value and actual cost one at a time on an illustrative $1.2M control account, move the status date month by month, and watch the variances, CPI, SPI and the estimate at completion fall out of the gaps.
What is earned value?
Earned value management compares three numbers at a status date: what you planned to do, what you actually did, and what it cost. Planned value (PV) is the budget for the work scheduled by that date. Earned value (EV) is the budget for the work actually completed. Actual cost (AC) is what the completed work cost. Put them side by side and you get cost and schedule performance in the same units, dollars of budget.
The point is the middle number. Comparing spending with the budget alone cannot tell you whether a job is under budget or just behind. Earned value can, because it measures progress against the same budget the plan used. The definitions here follow PMI and the ANSI/EIA-748 earned value standard.
Three curves and a status date
Step 7 of 7: Forecast the finish
- PV
- $720,000
- EV
- $600,000
- AC
- $660,000
- CV
- −$60,000
- SV
- −$120,000
- CPI
- 0.91
- SPI
- 0.83
- EAC
- $1,320,000
Start with the budget at completion (BAC): $1,200,000 for this control account. Spread it over the baseline schedule and you get planned value (PV), the budgeted cost of the work scheduled to be done by each date. Plotted cumulatively it makes an S: a slow start, a steep middle, a tail to $1,200,000 in month 10.
Pick the status date, the data date the measurement is taken at: the end of month 6. Planned value there is $720,000. By the baseline, 60% of the work should be done.
Earned value (EV) is the budget for the work actually done. Measured physically, the team has completed 50% of the scope, so EV is 50% × $1,200,000 = $600,000. EV is counted in budget dollars, whatever the work cost.
Actual cost (AC) is what that work really cost, from job cost to the same status date, with accruals for work in place: $660,000.
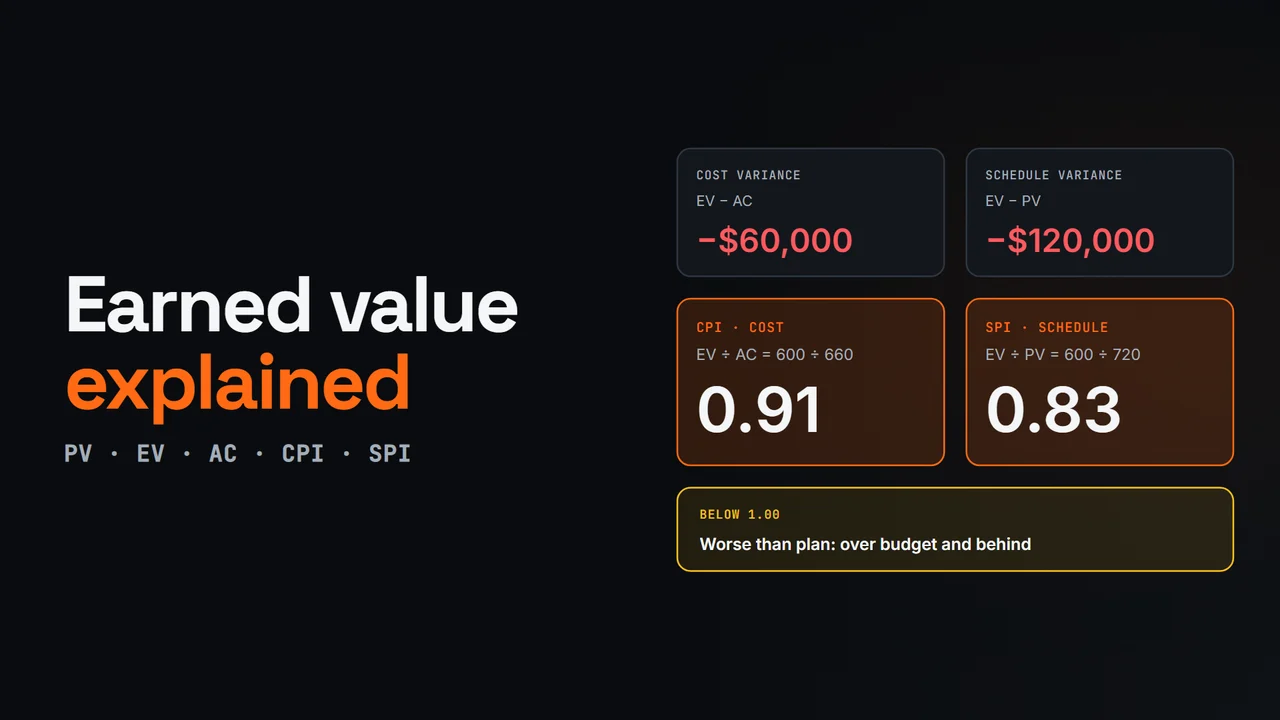
Cost variance CV = EV − AC = −$60,000: the work done cost more than its budget. Schedule variance SV = EV − PV = −$120,000: $120,000 of planned work has not been done yet. Both gaps show on the chart at the status date.
CPI = EV ÷ AC = 0.91: about 91 cents of budgeted work for every dollar spent. SPI = EV ÷ PV = 0.83: 83% of the planned work is done. Below 1.00 is worse than plan on both.
If cost efficiency stays where it is, the estimate at completion is EAC = BAC ÷ CPI = $1,320,000, a variance at completion of −$120,000. To finish on the original budget instead, the remaining work would need a TCPI of 1.11, better than anything the job has managed so far.
The month 6 numbers, written out
Every earned value measure comes from four inputs: BAC, PV, EV and AC. Here they are for the example at the month 6 status date.
BAC = $1,200,000     PV = $720,000     EV = $600,000     AC = $660,000

Cost variance        CV  = EV − AC        = −$60,000
Schedule variance    SV  = EV − PV        = −$120,000
Cost index           CPI = EV ÷ AC        = 0.91
Schedule index       SPI = EV ÷ PV        = 0.83
Estimate at compl.   EAC = BAC ÷ CPI      = $1,320,000
Estimate to compl.   ETC = EAC − AC       = $660,000
Variance at compl.   VAC = BAC − EAC      = −$120,000
To-complete index    TCPI = (BAC − EV) ÷ (BAC − AC) = 1.11
Move the status date and the picture is consistent: CPI has sat around 0.90 to 0.92 since month 1, so the overrun is steady, not a one-off. SPI has slid from 0.88 to 0.83, so the job is falling further behind each month. Here is every status date as a table:
| Status date | PV | EV | AC | CV | SV | CPI | SPI | EAC (BAC ÷ CPI) |
|---|---|---|---|---|---|---|---|---|
| Month 1 | $40,000 | $35,000 | $38,000 | −$3,000 | −$5,000 | 0.92 | 0.88 | $1,302,857 |
| Month 2 | $110,000 | $95,000 | $104,000 | −$9,000 | −$15,000 | 0.91 | 0.86 | $1,313,684 |
| Month 3 | $220,000 | $190,000 | $210,000 | −$20,000 | −$30,000 | 0.90 | 0.86 | $1,326,316 |
| Month 4 | $370,000 | $310,000 | $345,000 | −$35,000 | −$60,000 | 0.90 | 0.84 | $1,335,484 |
| Month 5 | $540,000 | $450,000 | $500,000 | −$50,000 | −$90,000 | 0.90 | 0.83 | $1,333,333 |
| Month 6 | $720,000 | $600,000 | $660,000 | −$60,000 | −$120,000 | 0.91 | 0.83 | $1,320,000 |
The earned value calculator runs the same formulas on your own BAC, planned and earned percent and actual cost, with three EAC formulas and TCPI side by side.
Earned value is only as good as percent complete
Earned value depends on measuring progress independently of cost. If percent complete is calculated as cost spent ÷ budget, then EV equals AC by definition, CPI is always 1.00 and every overrun disappears. The earned value technique decides how progress is credited:
- 0/100 and 50/50. Nothing until done, or half at start and half at finish. Simple and hard to argue with, best for short activities that finish within a period or two.
- Weighted milestones. Each milestone carries a share of the budget, earned when it is met. Good for longer work with clear stages, such as a steel package: shop drawings, fabrication, delivery, erection.
- Physical percent complete or units. Installed quantities against total quantities: yards of concrete, feet of pipe, devices set. The most direct measure, if the quantities are tracked.
Two more things keep the curves honest. Planned value is fixed by the schedule baseline, so PV does not move when the schedule is updated, and changes to it go through change control. And PV, EV and AC are all measured to the same data date; actual cost needs accruals for work in place, or EV runs ahead of AC and CPI flatters the job.
Why SPI goes back to 1.00, and what to use instead
SPI measures schedule performance in dollars, so it always returns to 1.00 at completion. When all the work is done, EV equals BAC equals PV, however late the job finished. Late in a project SPI says less and less, and it never tells you how many days behind you are.
Earned schedule answers that by converting EV back into time. In the example, EV at month 6 is $600,000. The baseline planned to reach $600,000 at about month 5.33, between month 5 ($540,000) and month 6 ($720,000). So the job has earned 5.33 months of schedule in 6 months, an SPI(t) of 0.89. Unlike SPI, SPI(t) does not drift back to 1.00 as the work finishes. For the critical path itself, use the schedule: the critical path explainer shows how one late activity moves the finish.
Three ways to forecast the finish cost
The estimate at completion depends on what you believe about the remaining work. The standard formulas give three different answers on the same month 6 numbers:
| Formula | Assumes | EAC |
|---|---|---|
| BAC ÷ CPI | Cost efficiency so far continues | $1,320,000 |
| AC + (BAC − EV) | The remaining work goes exactly to budget | $1,260,000 |
| AC + (BAC − EV) ÷ (CPI × SPI) | Cost and schedule performance both carry on | $1,452,000 |
The middle one is only believable if the overrun had a one-off cause, and a steady CPI like this one says it did not. The TCPI of 1.11 makes the same point from the other side: finishing on $1,200,000 would take cost efficiency the job has never shown. A bottom-up cost to complete from the project team should be checked against all three; the estimate at completion calculator compares five methods.
In os.construction, the Scheduling period performance and earned value features add nine Earned Value columns to the Planner (BAC, planned value, earned value, actual cost, cost and schedule variance, CPI, SPI and EAC) per activity, with planned value taken from the assigned project baseline. Earned value techniques and ETC techniques follow P6’s settings and can be set per WBS element, and Store Period Performance keeps each financial period’s actuals, earned value and planned value as an immutable record. The figures come from the schedule’s resource assignments, not the accounting ledger. See construction scheduling software.
Common questions
What are PV, EV and AC in earned value?
Planned value (PV) is the budgeted cost of the work scheduled to be done by the status date. Earned value (EV) is the budgeted cost of the work actually done by that date. Actual cost (AC) is what that work really cost. All three are cumulative to the same status date, and every other earned value measure is calculated from them and the budget at completion.
How do you calculate CPI and SPI?
CPI = EV ÷ AC and SPI = EV ÷ PV. In the example at month 6, EV is $600,000, AC $660,000 and PV $720,000, so CPI is 0.91 and SPI is 0.83. Below 1.00 means worse than plan: the work is costing more than budgeted and less of it is done than scheduled.
What does an SPI of 0.83 mean?
It means 83% of the work planned by the status date has been done, measured in budget dollars. It does not mean the job will finish 17% late, because SPI is a ratio of money, not time, and it drifts back to 1.00 as the job nears completion. A time-based measure such as SPI(t) from earned schedule, about 0.89 in the example, is better for forecasting the finish.
How is estimate at completion calculated from earned value?
The most common formula is EAC = BAC ÷ CPI, which assumes the cost efficiency so far continues. Others are AC + (BAC − EV), which assumes the rest goes to budget, and AC + (BAC − EV) ÷ (CPI × SPI), which assumes both indices carry on. In the example they give $1,320,000, $1,260,000 and about $1,452,000.
Why does earned value need a schedule baseline?
Planned value is the budget spread over the baseline schedule’s dates. Without a fixed baseline, PV moves every time the schedule is updated, the schedule variance measures nothing, and SPI always looks close to 1.00. The baseline is frozen; changes to it go through change control so the curve still means something.
Watch the explainer · 2:02
Earned value explained: PV, EV, AC, CPI and SPI
- 0:00Three numbers, one status date
- 0:20Planned value
- 0:38Earned value and actual cost
- 0:57Variances, CPI and SPI
- 1:20Forecast the finish
- 1:39Earned value in os.construction
Read the transcript
Earned value compares three numbers at the same status date: what you planned to do, what you actually did, and what it cost. Spending against the budget alone can't tell you whether a job is under budget or just behind. Earned value can, because it measures progress in budget dollars.
Start with the budget at completion. Take an illustrative control account with a budget of one point two million dollars, spread over a ten month baseline schedule. Planned value is the budget for the work scheduled by each date. At the end of month six, planned value is seven hundred twenty thousand dollars.
Earned value is the budget for the work actually done. The team has completed half the scope, so earned value is fifty percent of one point two million: six hundred thousand dollars. Actual cost is what that work really cost, from job cost with accruals: six hundred sixty thousand dollars.
Now read the gaps. Cost variance is earned value minus actual cost: minus sixty thousand, so the work cost more than its budget. Schedule variance is earned value minus planned value: minus one hundred twenty thousand. As ratios, CPI is zero point nine one and SPI is zero point eight three. Below one is worse than plan.
If cost efficiency stays where it is, the estimate at completion is the budget divided by CPI: one point three two million dollars, one hundred twenty thousand over budget. One caution: SPI is a ratio of money, not time. It drifts back to one as the job finishes, so don't read it as a finish date.
In os.construction Scheduling, the Planner shows earned value for each activity against the project baseline, with variances, CPI, SPI and the estimate at completion. Storing period performance keeps each period's figures as a permanent record.
Video page with chaptersMore in Construction concepts explained
Keep going
Sources and further reading
- PMI standards: the Standard for Earned Value Management defines PV, EV, AC, the variances, the indices and the EAC formulas used here.
- GAO Cost Estimating and Assessment Guide: earned value management, the ANSI/EIA-748 guidelines and estimate at completion methods.
- AACE International: cost engineering and project controls practice, including earned value.
General information only. Every figure on this page is illustrative.
Keep exploring
Related across os.construction
- Free toolEarned value calculatorPV, EV, AC, CPI, SPI, three EAC formulas, ETC, VAC and TCPI from four inputs.
- GlossaryEarned Value TechniqueThe rule that decides how much of an activity's budget counts as earned at a given point of progress, such as percent complete, 0/100 or 50/50.
- GlossaryFinancial PeriodA named date range, usually a month, that a schedule's actual units and costs are stored into, so cost performance can be reported per period rather than only to date.
- DocsPeriod performance and earned value: financial periods, Store Period Performance and EV columnsSet up financial periods for a project or the whole company, store each period's actual units and cost, earned value and planned value as an immutable record, and read earned value per activity in the Planner against the project baseline.
- Free toolConstruction schedule (Gantt) templateFree construction schedule template for Excel.
- BlogEarned value vs percent complete: one measures progress, the other tells you what it meansPercent complete says how much of the work is done. Earned value turns that progress into the budgeted value of the work done, so it can be compared with the plan and with what was spent. Here is how the two relate, when to use each, a worked example and the mistakes that make every job look on budget.
Want this on live job data?
In os.construction Scheduling, the Planner shows earned value per activity (BAC, PV, EV, AC, variances, CPI, SPI and EAC) against the project baseline, and Store Period Performance keeps each period’s figures as an immutable record.
14-day free trial. Pricing for paid plans isn't set yet. Talk to us. Already have an account? Sign in →
General information, not accounting or project controls advice. The control account and every figure on this page are illustrative. Your contract, your client’s reporting requirements and your earned value system description decide how progress is measured and reported.