See fade while there’s still time to fix it.
Analytics reads the records the company already runs on, from the first CRM pursuit to the last pay app: dashboards, pipeline and win rate, earned value, a weekly Project Story and a WIP view. It is in preview and turned on for every user, each seeing only the rows they may. On the sample job, Riverside Medical slips from a 13.2% bid margin to 11.4%, and the slide is visible by spring, not at year-end.
Drag the month. Watch 1.8 points leave Riverside.
Pick a job and drag the month slider. The margin chart and the WIP schedule recompute with the cost-to-cost method: percent complete, earned revenue and over/under billing for every job.
Riverside Medical
WIP schedule · Sep
4 of 14 jobs| Job | Contract | Est. cost | Cost to date | % comp. | Earned rev. | Billed | Over/(under) | Proj. margin |
|---|
Sample data · Riverside Medical Center, Job #24-118. An in-browser sketch on sample data. The real tools are in the app: start a trial to use them on your own project.
Every user. Every module. Only their rows.
Analytics is turned on for everyone, read-only by default. The same catalog covers projects, financials, field, safety, preconstruction and now CRM, and every tile runs with the viewer’s own permissions.
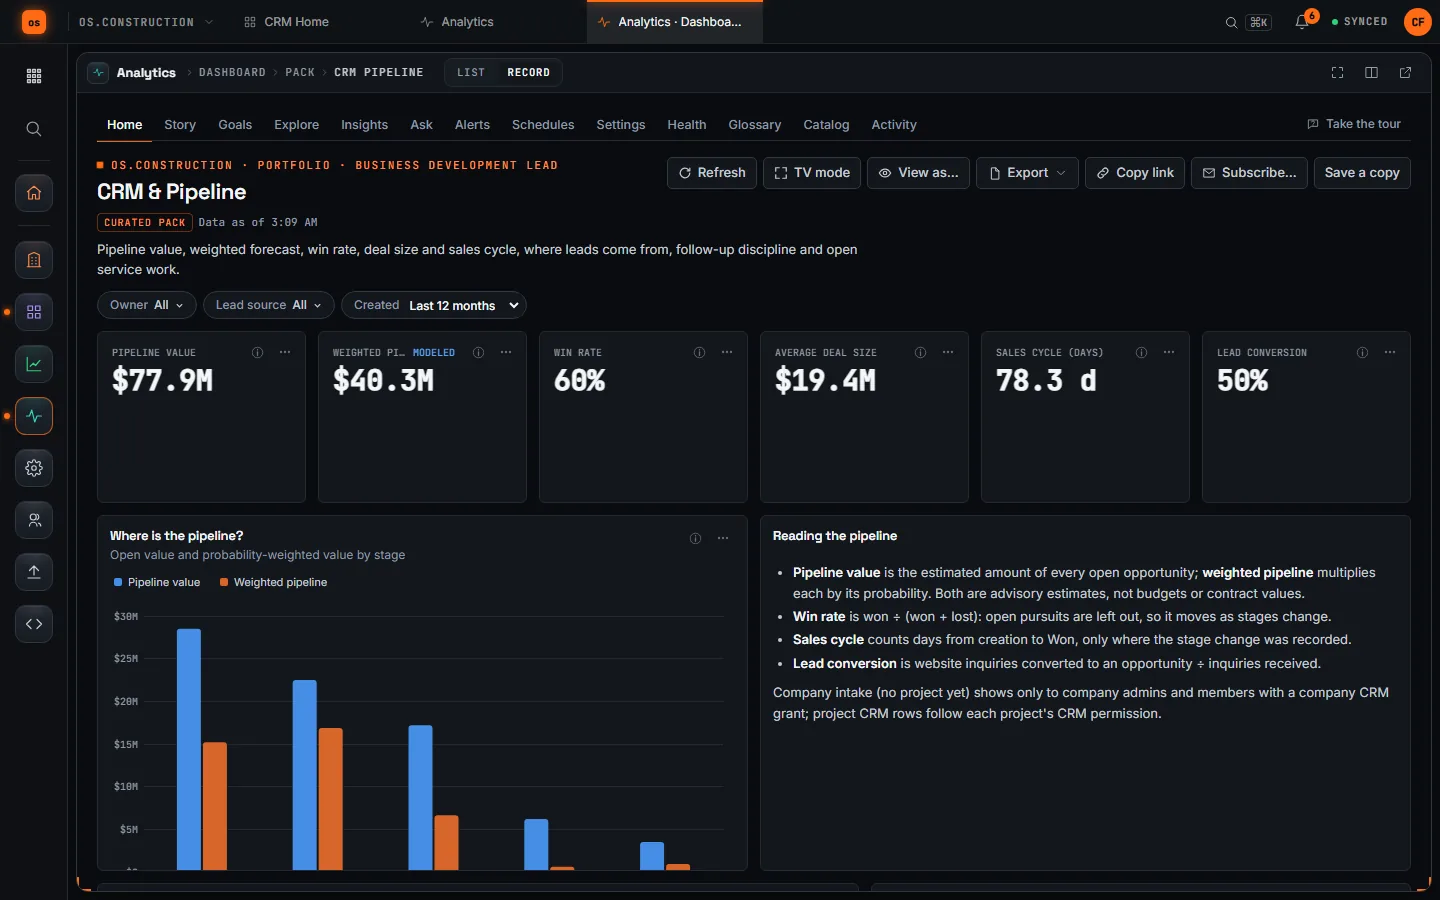
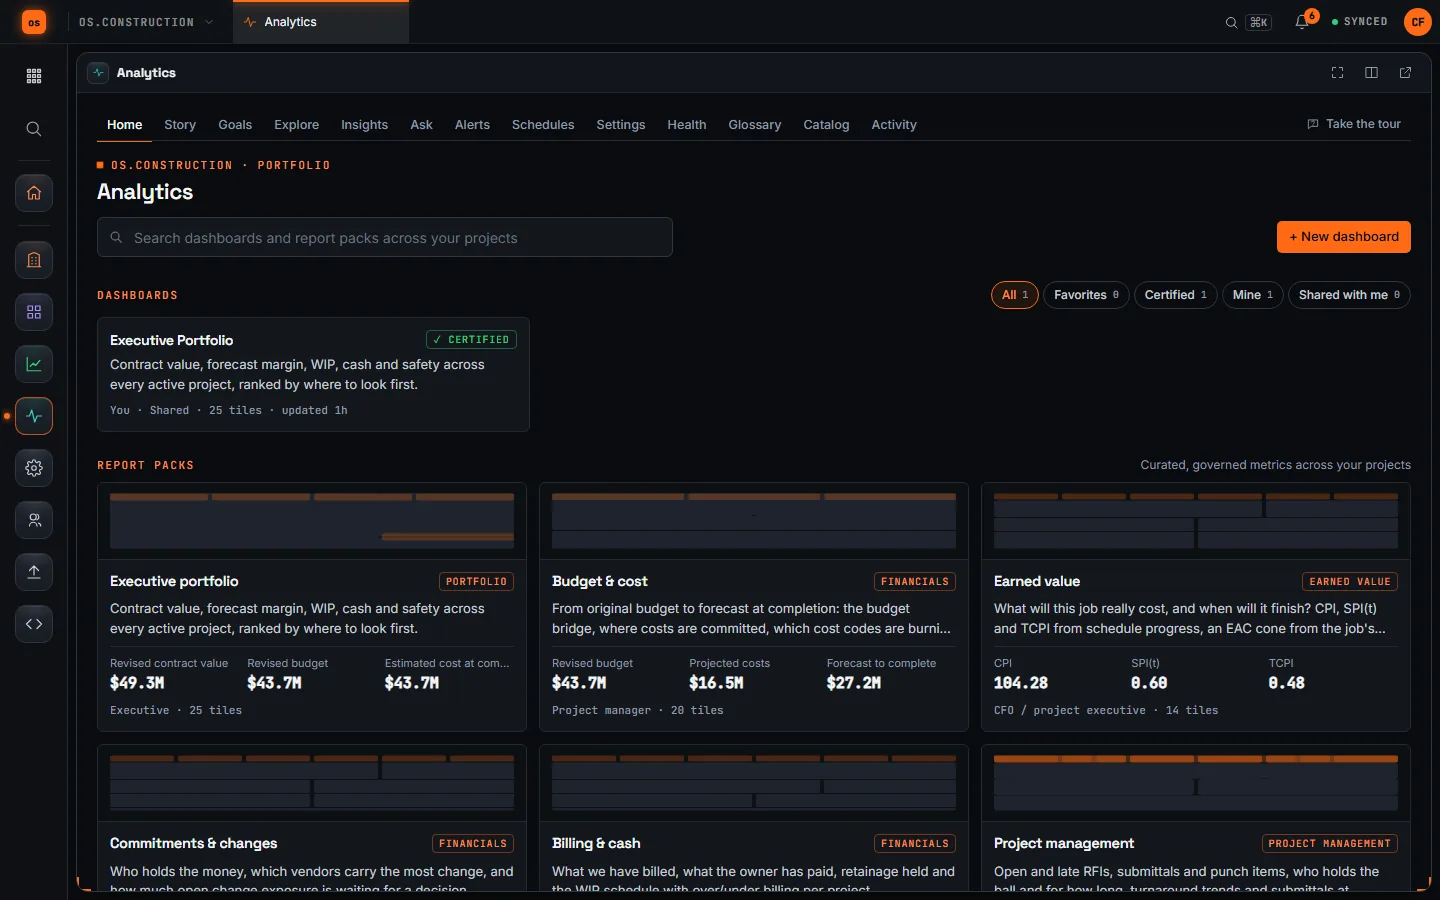
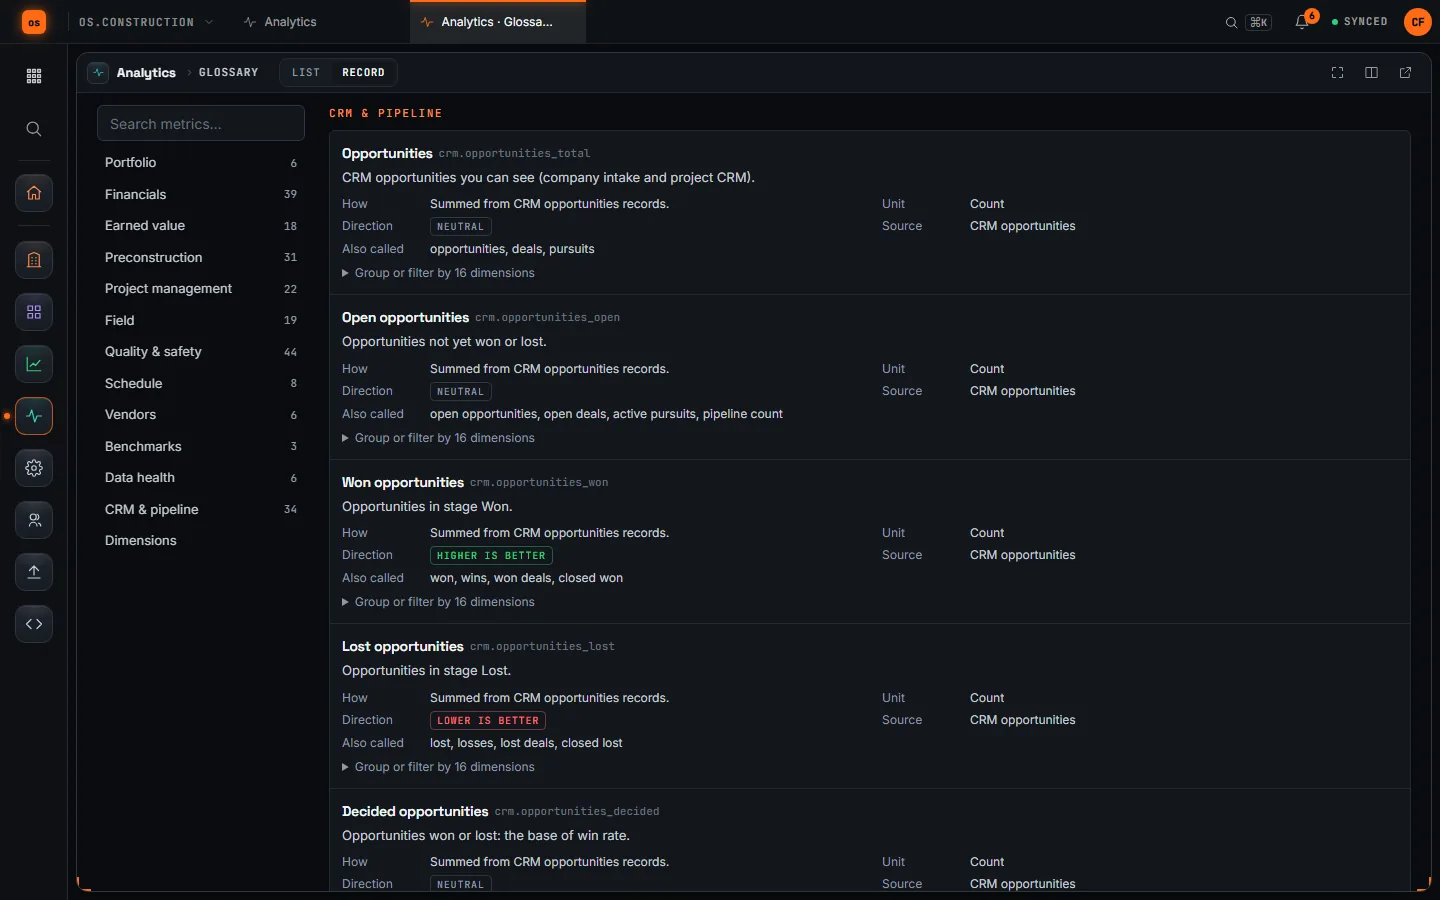
- CRMRiverside Medical Center pursuit$48.2M opportunity, owner and architect linked, marked Won
- ProjectJob #24-118Same contacts, same opportunity IDs. Nothing re-keyed.
- AnalyticsWin rate, pipeline, marginRead from the same rows, filtered to what each person may see
What Insights covers
1 of 14 are live in the app today. Preview items work with limits noted. Planned items are not built yet, and the founding cohort helps set the order.
- Preview
Dashboards and Explore
Ready-made packs and governed dashboards across every project tool, plus Explore to chart any of more than 280 defined metrics. Every number drills to its records and follows the tools’ own permissions.
- Preview
Parameters, forecasts and saved views
Let viewers switch a dashboard’s time grain, comparison (including year to date vs prior year) or metric. Add a modeled forecast with an 80% band, or an anomaly band that rings unusual points. Save filter sets as views, personal or shared.
- Preview
Analytics for every user
Every user has Analytics, read-only by default, and every tile runs as the viewer: tool permissions and row privacy apply, and a number you can’t read is blank, never zero. 360 Reporting is retired; its pages open Analytics.
- Preview
CRM, pipeline and preconstruction
Pipeline value, weighted pipeline, win rate, deal size, sales cycle, lead conversion, follow-ups, service cases and warranties, plus bid coverage, RFQ quote hit rate and prequalification. A CRM & Pipeline pack ties them together.
- Live
Cost-to-complete
PM forecasts by cost code in the budget, with snapshots to compare month over month.
- Preview
Portfolio and WIP
An Executive portfolio pack: project health, earned revenue, over/under billing, backlog and estimated gross profit per job, cost-to-cost, with month-end snapshots. Modeled numbers are labeled as modeled.
- Preview
Earned value
CPI, SPI, TCPI and EAC from schedule progress and job cost, with a P10–P90 forecast cone and an earned-schedule finish. Blank without a baseline. A slip scenario prices a delay from liquidated damages and general conditions.
- Preview
Project Story and Today
A weekly brief per project written from its own numbers, every sentence linked to its source. Super’s Today is a phone-first daily view of manpower, inspections, punch and late critical tasks.
- Preview
Goals and alerts
Goals on any metric with automatic status (met, at risk, behind), check-ins and scorecards. Alerts on metric changes, including percent change, sent only for projects each person can read.
- Preview
Benchmarks and field-to-finance checks
Percentile strips against similar projects you can see. Checks flag labor without daily logs, idle equipment still billing, cost without progress and delays without a change event.
- Preview
Ask and Explain this number
Ask a question in plain words and get a chart built from the metric catalog, never raw SQL. The ⓘ on a tile shows what’s counted, the dates, how fresh it is and why a number is blank.
- Preview
Share, present, publish
Share with people or roles, comment on a chart point, send branded PDFs on a schedule, only when a number crosses a line if you like, post deliveries to a webhook, run TV mode in the trailer, or publish an expiring report link once an admin turns links on. Admins can check access with View as.
- Planned
Margin fade vs bid
Estimated gross profit is tracked with month-end snapshots today. A view of fade against bid margin, by job and since when, is planned.
- Planned
Cash forecast
Billings, retainage and payables projected week by week.
How it connects to the rest of the OS
Insights doesn't sync with the other modules. It shares the same records, so a change here is already there.
Go deeperDocs, glossary and use cases
Read how it works
- Analytics BI guideGet started with Analytics, build a dashboard from the metric catalog, read the CRM & Pipeline pack, share and schedule results, and understand exactly which rows each person sees.Preview
- Moving from 360 Reporting360 Reporting is retired and its pages now open Analytics. Where each report, dashboard and schedule went, what still works over the API, and how to rebuild a report in a few minutes.Preview
- WIP and over/under billingHow a work-in-progress schedule is calculated with the cost-to-cost method, what over and under billing mean, and how we plan to compute it live (Planned).Planned
- Dashboards, earned value and WIPAnalytics (preview) builds dashboards, scheduled reports, earned value and a WIP view from the same records your team works in, for every user. Cash forecasting is Planned.Preview
- Cost codes and budgetsHow cost codes, cost types and budgets work in job costing, and how os.construction keeps budget, committed cost and actual cost on the same structure.Preview
- Key concepts: one data coreWhy os.construction keeps project records, project financials and reporting on a single record model, and what that changes day to day.Preview
Run your next job on it.
Start a 14-day free trial with a sample project already set up. Want a say in what ships next? Join the founding program.