Analytics BI guide
Get started with Analytics, build a dashboard from the metric catalog, read the CRM & Pipeline pack, share and schedule results, and understand exactly which rows each person sees.
Partly in the app today. Items marked Planned are not built yet.
On this page
- Get started
- Build a dashboard
- The metric catalog
- CRM and preconstruction metrics
- Project-module metrics
- The CRM & Pipeline pack
- Share, schedule and export
- Parameters, compare and overlays
- Add a parameter
- Add a forecast or an anomaly band
- Save a filter view
- Schedule smarter deliveries
- Send only if
- Send a saved view
- Post to a webhook
- Drill state in exports
- Analytics API
- Permissions and visibility
- Related
Analytics is the BI layer of os.construction. It reads the same records your team works in (RFIs, budgets, pay apps, daily logs, CRM pursuits) through a governed metric catalog, so a dashboard is a view of the data, not a copy of it. Every number drills to the records behind it, and every person sees only the rows their permissions already allow.
Get started
Open the launcher (the os mark top left, or Ctrl/⌘ + Space) and choose Analytics. It has its own section in the launcher, next to Project, CRM and Financials. Analytics works at two scopes:
- Company:
/companies/{company_id}/analytics, across every project you can read, plus company-level records such as CRM intake. - Project: Tools → Analytics on a project, narrowed to that project.
The first time you open it, a short tour points out the workspace switcher, a pack picked for your role, Ask and the ⓘ on a tile. You can replay it from Take the tour at the end of the section tabs.
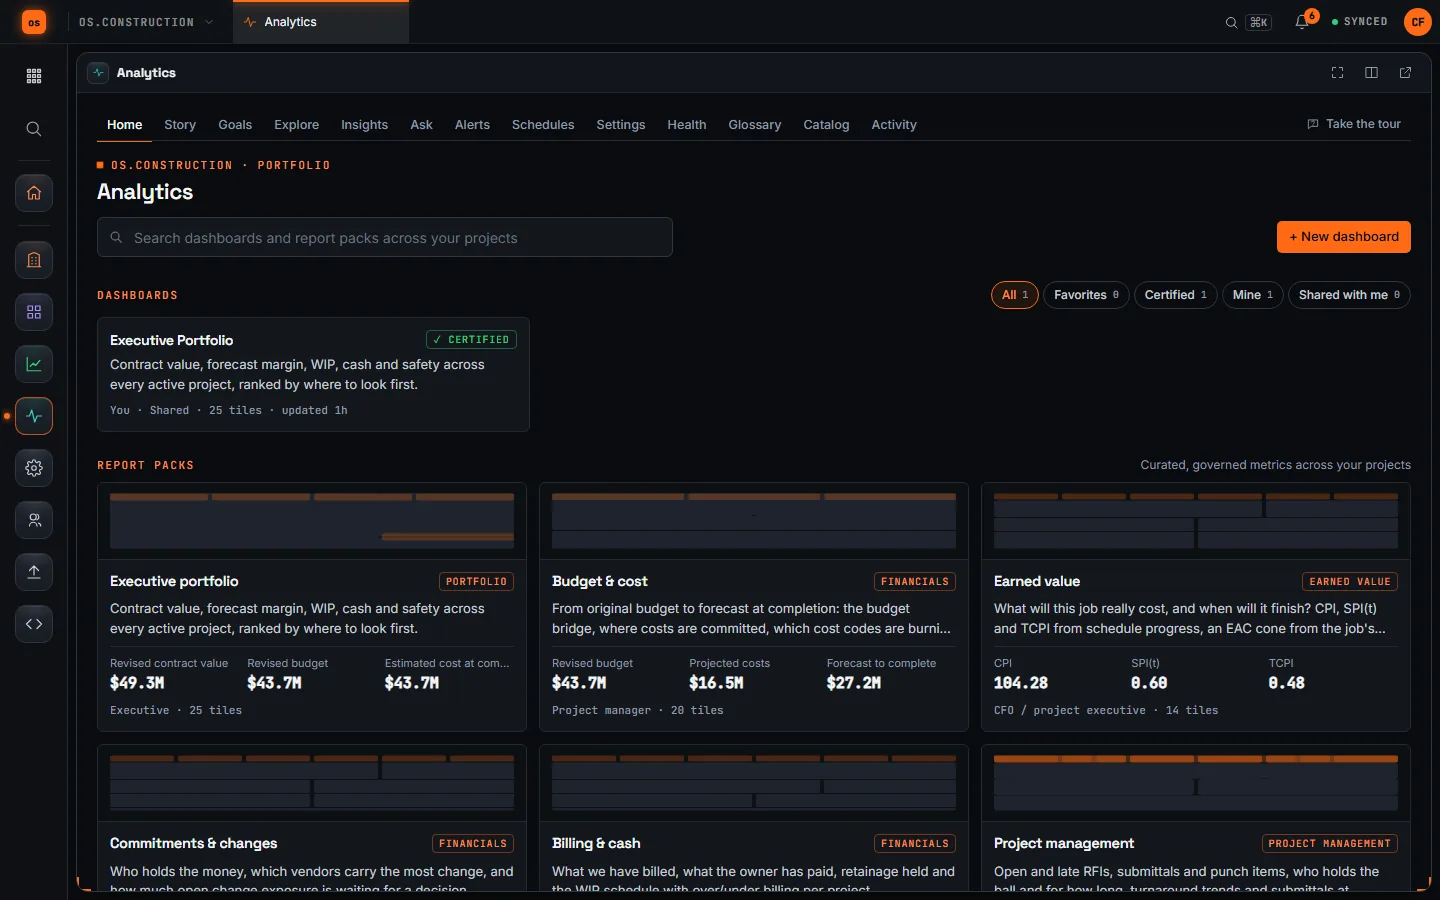
The section tabs are Home (packs and dashboards), Story, Goals, Explore, Insights, Ask, Alerts, Schedules, Health and Glossary. Analytics admins also see Settings, Catalog and Activity.
Build a dashboard
The fastest start is a report pack: a curated dashboard for one job to be done, such as Executive portfolio, Project management, Budget & cost or CRM & Pipeline. Packs are read-only. To change one, make a copy.
-
Open a pack and save a copy
On Home, open a pack under Report packs and choose Save a copy. The copy is yours, private until you share it. Creating dashboards needs the Standard analytics level or higher.
-
Add tiles
Choose Edit dashboard, then Add tile. Pick metrics from the catalog, a grouping (project, cost code, stage, owner, month…) and a chart: KPI, bar, line, table, record list and more. Each tile can carry its own filters, targets and conditional formatting.
-
Set filters and pages
Dashboard filters (date range, project, owner…) apply to every tile that can take them. Split a long dashboard into pages with Add page.
-
Save
Save changes keeps a version. History lists earlier versions; restoring one saves it as a new version, so nothing is lost.
Explore is the ad-hoc path: pick any metric, split it by any compatible dimension, and Add to dashboard when the chart earns a place. Ask takes a plain-language question (“win rate by lead source this year”) and builds the chart from the catalog, never from raw SQL.
The ⓘ on every tile is Explain this number: what is counted, the exact date window, how fresh it is, how many of your projects it covers and, if it is blank, why.
The metric catalog
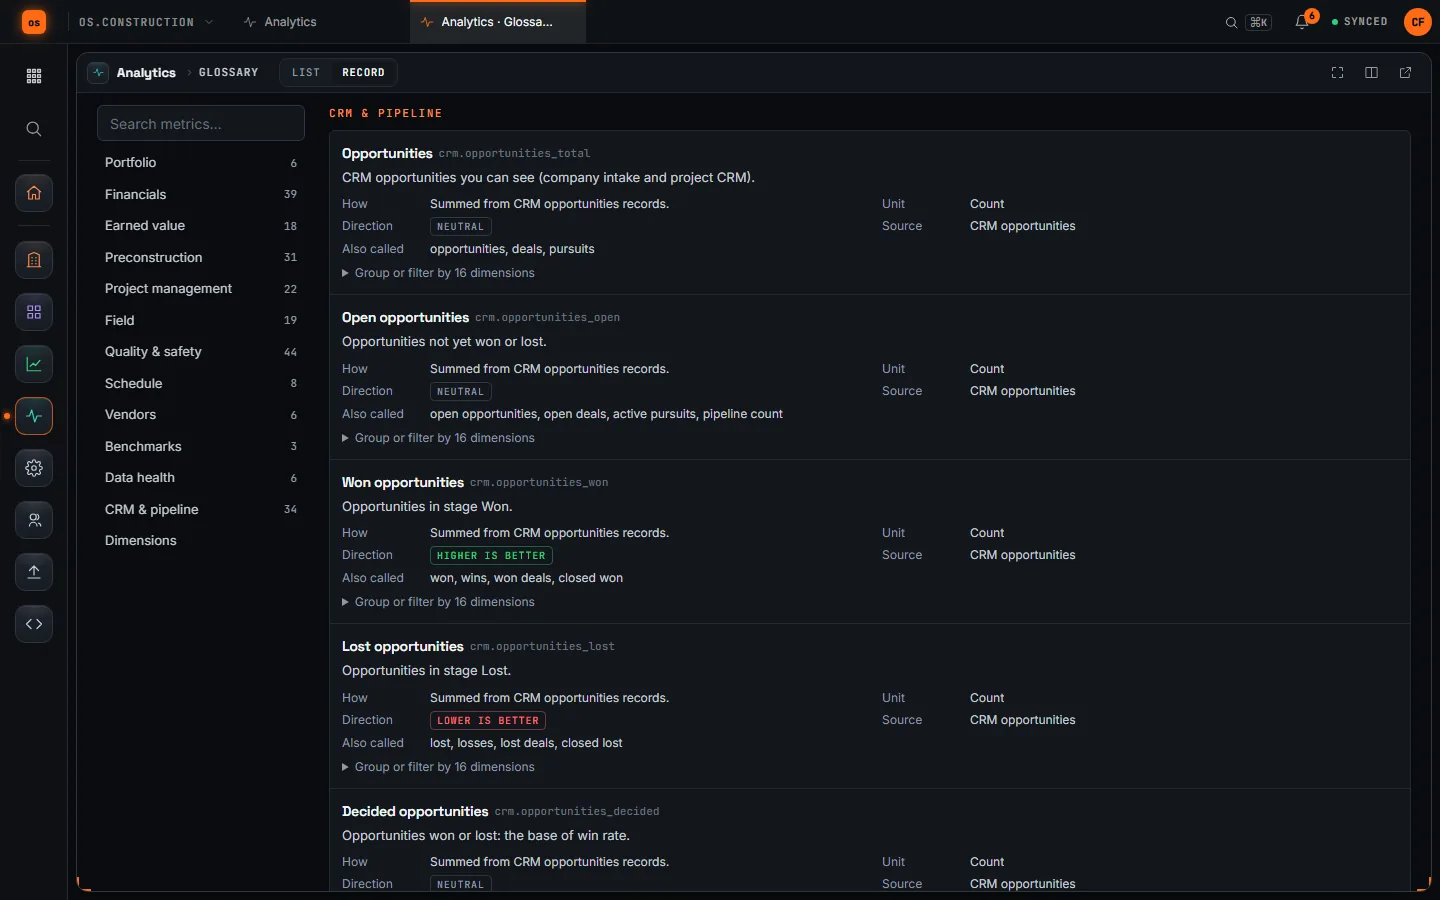
Every metric has a definition, a unit, a direction (higher or lower is better) and the dimensions it can be split by. The Glossary tab lists every metric and dimension you can read. The catalog has 283 metrics across these domains:
| Domain | Metrics | Examples |
|---|---|---|
| CRM | 34 | Pipeline value, weighted pipeline, win rate, average deal size, sales cycle, lead conversion, lead first response, overdue follow-ups, open service cases, warranties expiring |
| Preconstruction | 31 | Bid coverage, vendor hit rate, bid spread, RFQs, quote coverage, quote hit rate, prequalification approval rate, prequalifications expiring |
| Financials | 39 | Revised budget, committed costs, estimated cost at completion, projected over/under, earned revenue, over/under billing, estimated gross profit, backlog, retainage held |
| Project management | 41 | Open and late RFIs, days to close, RFIs with cost or schedule impact, submittals at procurement risk, overdue tasks and meeting action items, open coordination issues |
| Quality & safety | 50 | Punch, observations and inspections (open, late, days to close), inspection pass rate, TRIR, LTIFR, days since last recordable, forms in review, active action plans |
| Field | 25 | Man-hours, overtime, equipment utilization, delay hours, daily log compliance, T&M value pending, photos captured |
| Earned value | 18 | CPI, SPI, SPI(t), TCPI, EAC, VAC, forecast finish slip |
| Schedule | 8 | Late critical tasks, milestones in the next 30 days, % tasks complete |
| Vendors | 11 | Revised commitment amount, % change orders, subcontractor billed, subcontractor retainage held |
| Document control | 11 | Current drawings, drawing revisions issued, transmittals not delivered, overdue transmittals, late correspondence |
| Portfolio | 6 | Active projects, cost per SF, health score |
| Benchmarks | 3 | RFIs per $1M contract, change orders % of contract, man-hours per 1k SF |
| Data health | 6 | RFIs missing a due date, manpower entries missing a vendor |
Analytics admins can add company metrics without code under Catalog: a segment of an existing metric, a ratio of two metrics, or a formula over them. Custom fields on your records appear as dimensions automatically, and value groups bucket a dimension into named bands.
CRM and preconstruction metrics
The CRM domain reads company intake (pursuits with no project yet), project CRM, website inquiries, follow-ups, service cases, customer service requests and installed assets. The preconstruction domain adds RFQs and prequalification next to bidding. The definitions that matter most:
| Metric | Definition |
|---|---|
| Pipeline value | Estimated amount of open opportunities (not Won or Lost). An advisory USD estimate, not a budget. |
| Weighted pipeline | Each open amount × its probability, summed. Labeled Modeled. |
| Win rate | Won ÷ (Won + Lost). Open pursuits are left out, so it moves as stages change. |
| Average deal size | Won value ÷ won opportunities. |
| Sales cycle | Average days from creation to Won, only where the stage change was recorded. Older wins are left out rather than guessed. |
| Lead conversion rate | Website inquiries converted to a contact and opportunity ÷ inquiries received. |
| Lead first response | Average hours from submission to the first staff-reported response. |
| Overdue expected close | Open opportunities whose expected close date has passed. |
| Quote hit rate | RFQ quotes awarded ÷ quotes received. Split by vendor to see who wins what they price. |
| Prequalification approval rate | Approved ÷ (approved + rejected) prequalification submissions. |
The 34 CRM metrics, by source:
| Source | Metrics | What they count |
|---|---|---|
| Opportunities | 12 | Opportunities, open, won, lost and decided; win rate; pipeline value; weighted pipeline; won value; average deal size; sales cycle (days); overdue expected close |
| Website inquiries | 7 | Leads, new, converted and dismissed; lead conversion rate; leads past response target; lead first response (hours) |
| Activities | 4 | CRM activities, open follow-ups, overdue follow-ups, completed activities |
| Contacts | 1 | CRM contacts |
| Service cases | 5 | Service cases, open, past response target, warranty-covered; service resolution (days) |
| Customer requests | 2 | Customer service requests, open customer requests |
| Installed assets | 3 | Installed assets, assets under warranty, warranties expiring (90 days) |
The preconstruction domain adds 16 more: 10 for RFQs and quotes and 6 for prequalification.
Project-module metrics
Twelve sources cover the remaining project tools, with 47 metrics between them. Each follows that tool’s own read permission and, where the tool has private records, its row privacy.
| Source | Domain | Metrics | What they count |
|---|---|---|---|
| Tasks | Project management | 5 | Project tasks; open, overdue and closed; % late |
| Meetings | Project management | 2 | Meetings, meetings held |
| Meeting action items | Project management | 6 | Action items; open, overdue and closed; % late; average days to close |
| Coordination issues | Project management | 6 | Issues; open, late and closed; % late; high-priority open issues |
| T&M tickets | Field | 5 | Tickets, tickets pending review, value pending, value approved, value claimed |
| Photos | Field | 1 | Photos captured |
| Subcontractor invoices | Vendors | 5 | Invoices, billed, pending, approved, retainage held |
| Forms | Quality & safety | 3 | Form submissions, forms in review, forms approved |
| Action plans | Quality & safety | 3 | Action plans, active, completed |
| Drawing revisions | Document control | 2 | Drawing revisions issued, current drawings |
| Transmittals | Document control | 3 | Transmittals, not delivered, overdue |
| Correspondence | Document control | 6 | Correspondence items; open, late and closed; % late; average days to close |
Tasks and coordination issues record no close date, so they have no days-to-close metric. Open tasks, overdue tasks, open and overdue action items, open coordination issues, T&M value pending and open correspondence keep nightly history, so they can trend and feed insights.
The coordination issue aging insight flags a project when too many open coordination issues are older than the aging window (30 days by default). Analytics admins set the window for the company under Settings, and can give a project its own window on the project’s analytics settings page. Clearing the project value goes back to the company window.
The Document control pack shows the live drawing set and revisions issued by discipline, transmittals not yet delivered and correspondence waiting for a reply. The Project management, Field operations, Quality & safety, Commitments & changes and Billing & cash packs gained tabs or tiles for these sources.
Analyze on a tool’s list page opens the pack for that tool on the project: RFIs, submittals, punch list, budget, commitments, daily log, incidents, inspections, observations, schedule, tasks, meetings, coordination issues, T&M, correspondence and transmittals. On company CRM Home it opens the CRM & Pipeline pack; in project CRM it opens the project’s own CRM & Pipeline pack. It appears only when you can open Analytics there.
The CRM & Pipeline pack
CRM & Pipeline is a company-scope pack for whoever owns business development. Open it from Home under Report packs.
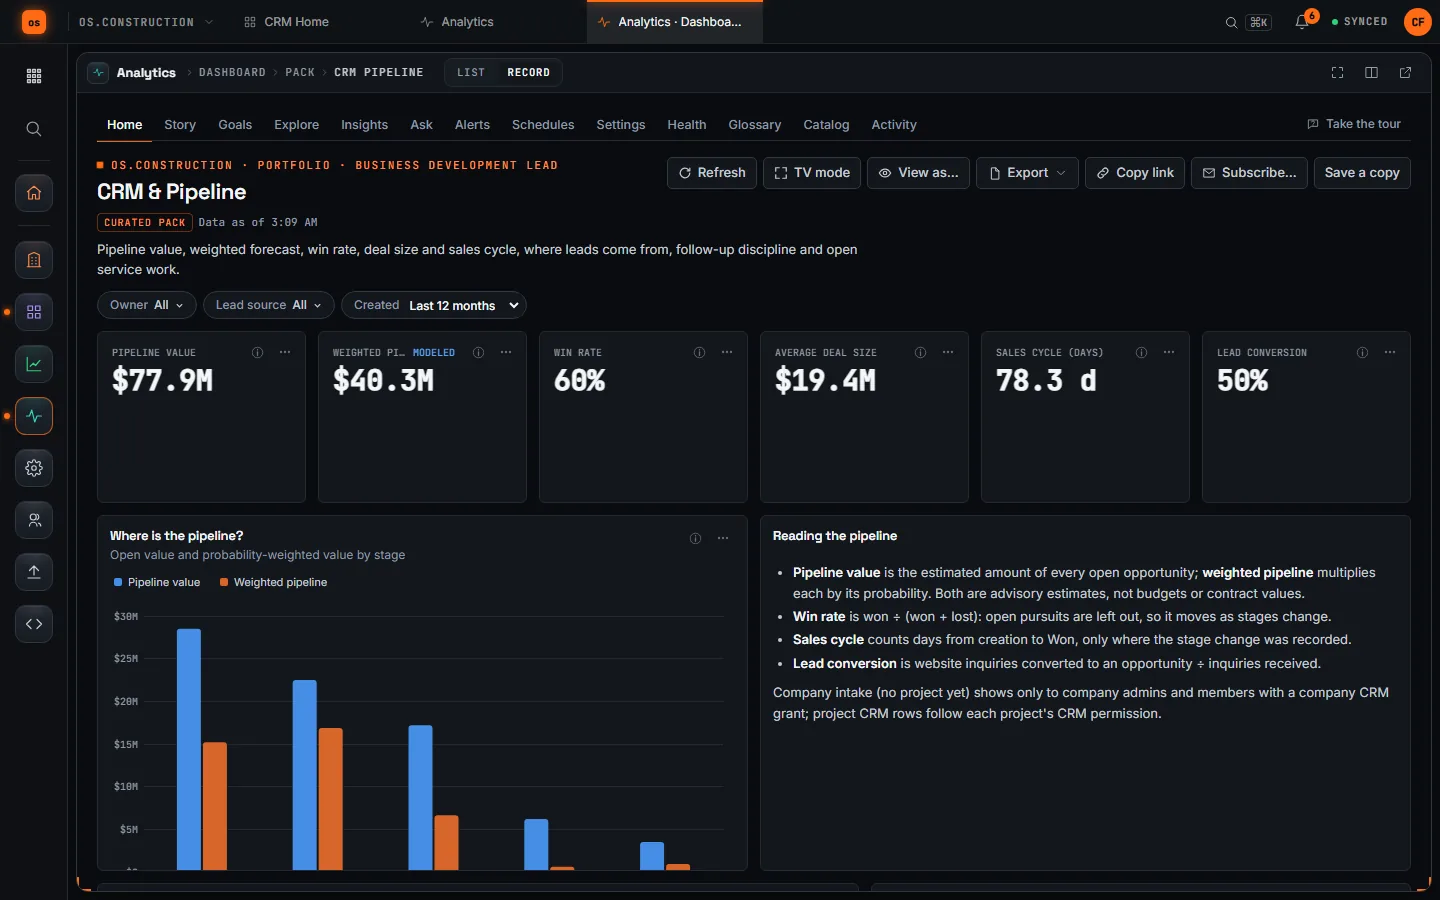
- Headline KPIs: pipeline value, weighted pipeline, win rate, average deal size, sales cycle and lead conversion.
- Where is the pipeline? Open value and weighted value by sales stage, Qualification through Negotiation.
- Where do wins come from? Opportunities, wins, win rate and won value by lead source (repeat customer, referral, invitation, public bid, website…). Click a row to filter the whole dashboard.
- Won value by month and Leads by month, by outcome.
- Pipeline by owner: open deals, value, weighted value, wins and win rate per person.
- Follow-through: overdue expected close, overdue follow-ups, leads past their response target, open service cases, open customer requests and warranties expiring in 90 days.
- Open opportunities by expected close: a record list, soonest first. Each row opens the opportunity in CRM.
Filters: owner, lead source and created date (last 12 months by default). Like every pack, save a copy to change it.
In a project, Analyze in project CRM opens the same pack for that project only. Website inquiries belong to company intake, so lead conversion, leads by month and leads past their response target give way to open follow-ups, service cases by month and cases past their response target. Rows follow the project’s CRM permission.
Share, schedule and export
- Share a dashboard or exploration with people or with a role (every holder of a permission template), as view or edit. A share grants the dashboard, never the data: each viewer’s tiles still run with their own permissions.
- Comments sit on a dashboard, a tile or a single chart point, with @mentions that notify only people who can open it.
- Subscribe… schedules a dashboard, exploration, pack or Project Story daily, weekly or monthly, as CSV, XLSX or PDF, to up to 50 recipients. Each recipient gets their own render, as themselves. A company schedule can split into one file per project.
- Export downloads CSV, XLSX or a branded PDF, and any chart copies or downloads as PNG or SVG.
- TV mode runs a dashboard full screen, refreshing every 5 minutes, and can cycle pages.
- Publish link creates a frozen, expiring read-only snapshot that opens without a sign-in. It is off until an analytics admin turns it on, and turning it off stops every existing link.
- Alerts notify you when a metric crosses a threshold or moves by a percentage, per project if you like. Goals track a metric against a target with automatic status.
Parameters, compare and overlays
Add a parameter
A parameter is a dashboard control that changes how tiles run rather than which rows they read.
-
Open the editor
On a saved dashboard, choose Edit dashboard, then + Filter…. Parameters are listed under Parameters.
-
Pick the kind
- Time grain re-buckets every time axis (day, week, month, quarter or year).
- Compare sets every tile’s comparison: none, previous period, previous year or year to date vs prior year to date.
- Metric lets the viewer swap a tile’s metric for one of 2 to 8 options. A tile switches only when the chosen metric supports every grouping the tile uses.
A dashboard can have one time grain and one compare parameter. To keep a tile out of one, open the tile’s Filter mapping and choose Ignore this parameter.
-
Save
Viewers see each parameter as a menu in the filter bar. As designed puts every tile back the way it was saved.
YTD vs prior YTD compares January 1 to the end of the range with the same days of the previous year (February 29 falls back to February 28). In Explore it is on the Compare menu next to previous period and previous year. Over the API a query can also compare against a fixed offset, such as 90 days or 12 months earlier.
Add a forecast or an anomaly band
On a line or area chart over time with no split, open the tile’s Format panel and find Forecast & anomalies.
- Forecast extends each series by 1 to 24 periods (6 by default) as a dashed trend line with an 80% band, marked FORECAST and labeled modeled in the tooltip. It never projects a count or amount below zero.
- Anomaly band shades the expected range from the 8 periods before each point and rings points that fall outside it. They are listed in the tooltip and the chart description.
Both draw the same way in PDF exports. A chart split by a second dimension shows a note instead: remove the split to project the trend.
Save a filter view
A saved view stores a dashboard’s filters under a name, so you can switch between, say, “My projects, this quarter” and “Riverside, open items” without rebuilding them.
- Save view… in the filter bar names the current filters. A view is personal until shared. Dashboard editors can tick Share with everyone who can open this dashboard.
- Saved views… applies one. Your views are under Mine, shared views under Shared.
- Delete view removes the applied view: your own, or a shared one if you can edit the dashboard.
Anyone who can open a saved dashboard can keep up to 50 personal views on it. Nobody else sees a personal view.
Picking a view puts it in the address bar as ?view=<id>, so Copy link shares the view itself: later edits to a shared view reach everyone who opens the link. If the link names a view you can’t use (it was deleted, belongs to another dashboard, or is someone else’s personal view), the dashboard opens with its default filters and a short notice: “That saved view isn’t available. Showing the dashboard’s default.” The notice is the same in every case, so it never reveals whether a personal view exists. Changing a filter by hand drops the view from the link and keeps your filters instead. Subscribe… carries the picked view into the new schedule. A view stores filters, never data: each viewer’s tiles still run with their own permissions.
Schedule smarter deliveries
Send only if
In a schedule, open Send only if and tick Only send when a number meets a condition. Pick a metric, a condition (above, below, up by %, down by %), a threshold and a window (the last 30 days by default). Under Only counting, + Filter narrows the number, for example to one project or status.
The condition is checked before each delivery, with the schedule owner’s access. If it isn’t met, or the number can’t be read, nothing is sent and the run shows as skipped. The skip records the rule, never the value.
Send a saved view
A dashboard schedule can name a Saved view: its filters apply first, then the schedule’s own. A personal view can only be sent to its owner; share it to send it to others. If the view is deleted or un-shared later, the delivery stops with an error rather than send unfiltered data.
Post to a webhook
Analytics admins can tick Also post to the company’s webhooks on a dashboard, exploration or pack schedule. Each run then sends one analytics.schedule.delivered event to the company’s webhook subscriptions.
- The event carries the schedule’s details and a signed download link, never metric values or rows.
- The file behind the link is rendered once with the schedule owner’s access, not each recipient’s. Hand the link only to systems that may see the owner’s view.
- A schedule split one per project sends one event per project, each with
project_idand a link to that project’s file. - The link expires within 7 days and opens without a sign-in, so it follows the published report links setting: with links off, the event still arrives without a link, and existing links stop opening.
Drill state in exports
If you broke out, zoomed or widened a tile, Export on the dashboard includes that change, so the file matches the screen. Schedules always follow the saved dashboard. To send the drilled view on a schedule, save it to the dashboard first.
Analytics API
Everything above is available over REST at /rest/v1.0/companies/{company_id}/analytics, running as the token’s user with the same permissions: the catalog, ad-hoc and batch queries, dashboard, pack and exploration data as JSON, CSV, XLSX or PDF, saved views, and schedules with conditions and webhook delivery. See the Analytics API guide for examples, including Excel, Power BI and Google Sheets.
Permissions and visibility
Who gets Analytics. Every user. Default permission templates include Analytics at Read only; templates without an Analytics entry get Read only too. Admins can raise a template to Standard (create dashboards, explorations, alerts, goals and schedules) or Admin (settings, catalog, certify, every item).
What they see inside it. Granting Analytics exposes no extra data, because every tile runs as the viewer:
- Tool permissions. Each metric needs read access to the tool it comes from. No Budget access means budget metrics come back blank, with Explain saying why.
- Row privacy. Tools with private records (RFIs, punch, submittals, commitments and others) apply the tool’s own visibility rules, row by row.
- Projects. Company analytics covers only projects where you have Analytics and the tool is on.
- CRM. Company intake and website inquiries need a Company CRM grant (or company admin). Project CRM rows follow each project’s CRM permission. Neither grants the other.
- RFQs and bidding fail closed: vendor staff never see them, and private RFQs count only for their creator or assignee below tool admin.
- API tokens add a ceiling: a token sees a source only with that tool’s read scope.
Company admins can open a dashboard with View as to check exactly what a teammate sees. The preview is read-only and every use is audited.
Related
Keep exploring
Related across os.construction
- DocsDashboards, earned value and WIPAnalytics (preview) builds dashboards, scheduled reports, earned value and a WIP view from the same records your team works in, for every user. Cash forecasting is Planned.
- BlogWin rate, weighted pipeline, sales cycle: the pipeline numbers a contractor should watchA big pipeline number feels good and tells you little. Six pipeline metrics, how to calculate each one honestly, the mistakes that inflate them, and how they connect to backlog.
- DocsConstruction CRMThe CRM module, app by app. Pipeline, contacts, follow-ups, website inquiries, organizations and people, inquiry forms, import and export, then the project handoff, proposals, service and warranty.
- Blogos.construction is open for trialsThe app is live at app.os.construction. Start a 14-day free trial: project management and project financials today, with separate company accounting workflows and planned AI agents. Here's exactly what's live and what isn't.
- GlossaryWin RatePursuits won divided by pursuits decided (won plus lost). Open pursuits are left out.
- GlossaryPipeline ValueThe total estimated value of every open pursuit: work you're chasing that hasn't been won or lost yet.
Was this helpful?
Run it on your own project.
Start a 14-day free trial. Want a say in what ships next? Join the founding program.
14-day free trial. Pricing for paid plans isn't set yet. Talk to us. Already have an account? Sign in →