Reading your project dashboard
Six tiles, one sentence each, and the arithmetic behind them. Read the project desktop and the Budget & cost pack on Riverside Medical Center, and learn which number to question first.
The project desktop
Desktop in the dock opens the project home: widgets that sum up the job, each showing only numbers from tools you're allowed to see. Here they are on Riverside (sample data; the committed figure is illustrative).
- Contract$49.3M$48.2M original + $1.1M approved COs
- Committed$36.8M86.3% of the $42.64M original budget
- Billed$33.0M66.9% of the contract
- Margin$5.62M11.4% · revised contract vs projected cost
Two percent-completes, never mixed: billed is 66.9% of the contract, but cost to date is 72.6% of estimated cost. The gap is why cost-to-cost percent complete and under billing matter.
Six tiles, one chain of arithmetic
The pack says it plainly: these numbers use the same math as the Budget tool, line for line. Scroll to build each tile from the one before.
- Tile 1 · sample data
Revised budget
The original cost budget plus transfers and approved budget changes. Pending changes aren't in it yet; they're added to get the projected budget.
- Tile 2
Projected costs
What you've committed (subcontracts and POs with their approved changes), plus direct costs, plus pending cost changes. It's money already spoken for, not money spent.
- Tile 3
Forecast to complete
The cost still to come. Where the PM has entered a manual forecast to complete on a budget line, the pack uses it; otherwise it falls back to the remaining budget, never negative.
- Tile 4
Estimated cost at completion
Projected costs plus forecast to complete. On Riverside that lands on the job's estimated total cost.
$38,950,000 + $4,729,800 = $43,679,800 - Tile 5
Forecast over/under
Projected budget minus EAC. Positive means the forecast is inside budget; negative is a forecast overrun. Here it's a thin +$120,200: worth watching, not celebrating.
- Tile 6
% committed
Committed costs over revised budget. High and rising means buyout is mostly done and the remaining risk is in what's not bought yet. The Bought out vs burned chart on the Cost codes tab sets it against percent complete by cost code.
- Back on the desktop
Margin ties it to the contract
The desktop's Margin widget sets the revised contract against projected cost. Same EAC, one more subtraction.
$49,300,000 − $43,679,800 = $5,620,200 (11.4%, against 13.2% at bid)
How did we get from the original budget to today's?
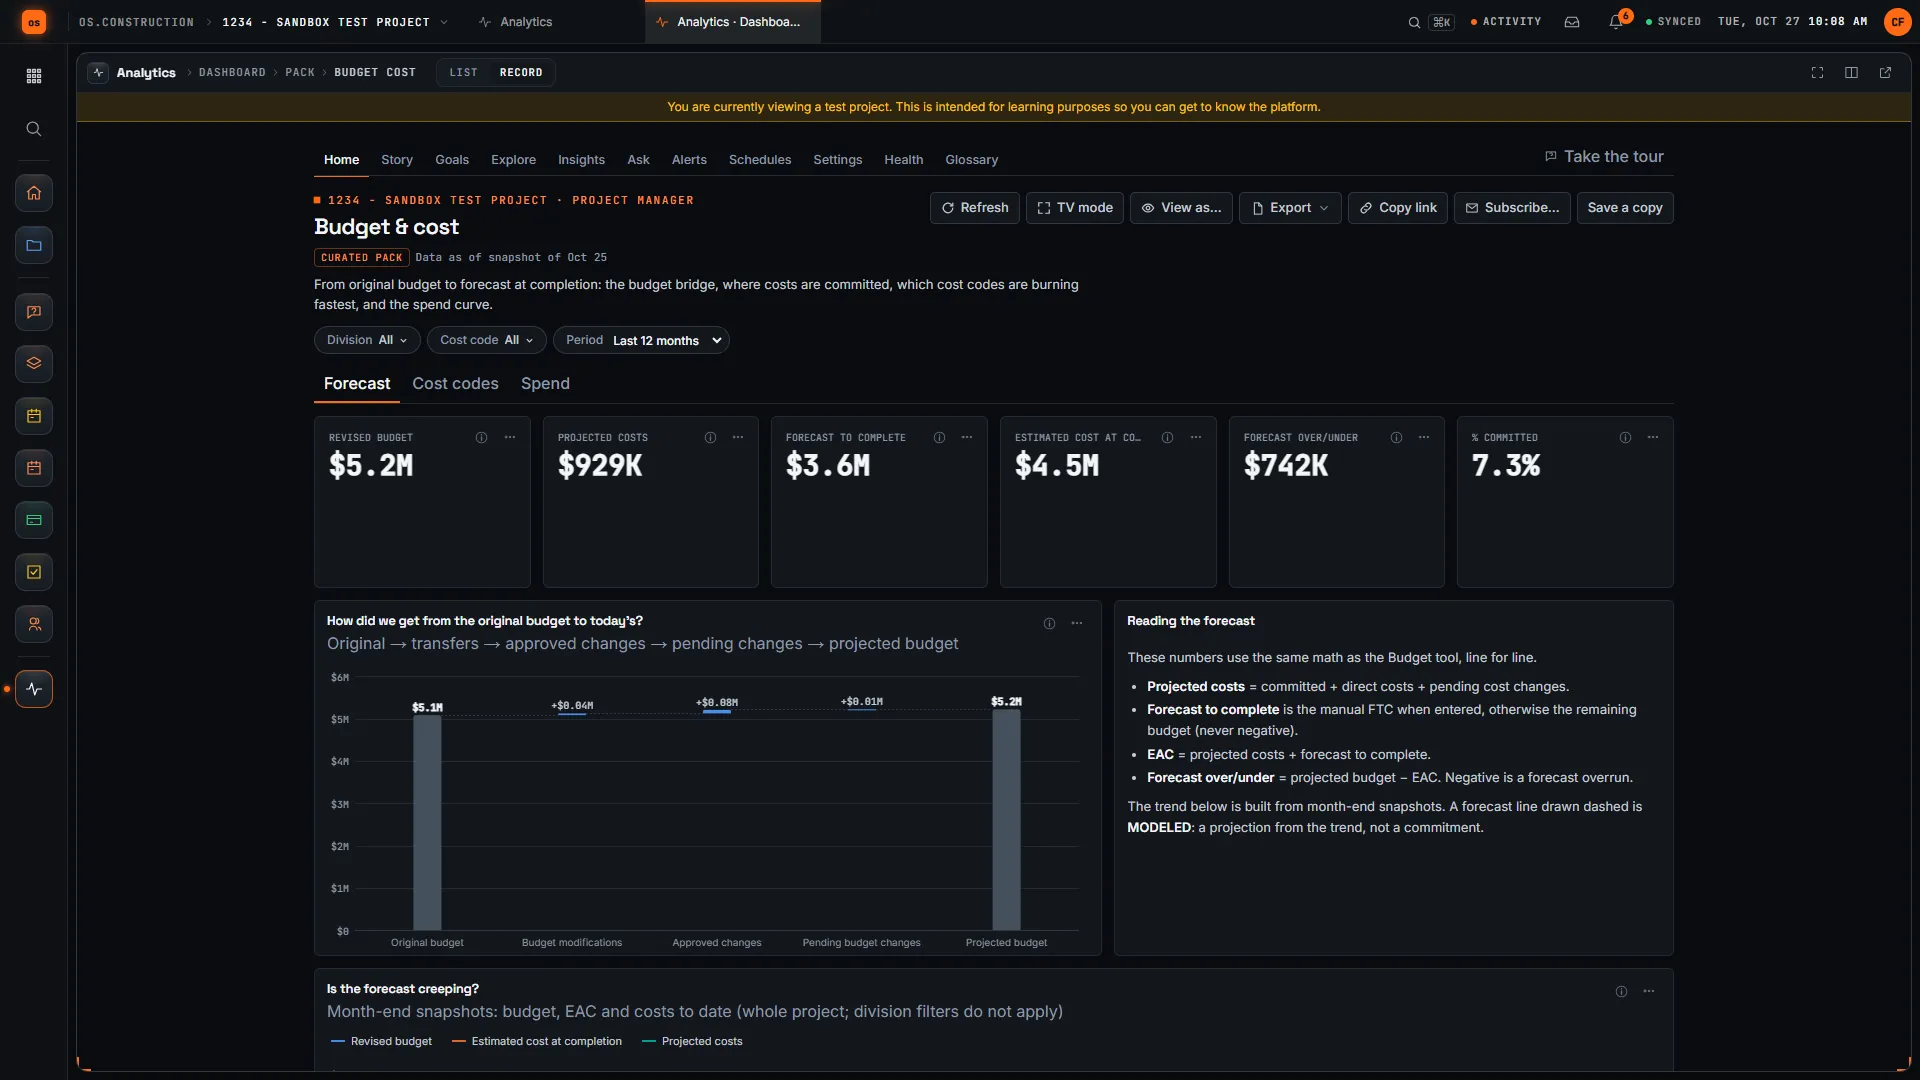
The pack's first chart walks original budget → transfers → approved changes → pending changes → projected budget. Riverside's version, with illustrative budget lines; the axis starts at $42M so the changes are visible.
The Budget & cost pack
Recorded in the app on a test project, so the figures differ from Riverside. The Forecast tab holds the six tiles, the budget bridge and a Reading the forecast panel with the formulas above. Filters for division, cost code and period sit above the tabs.
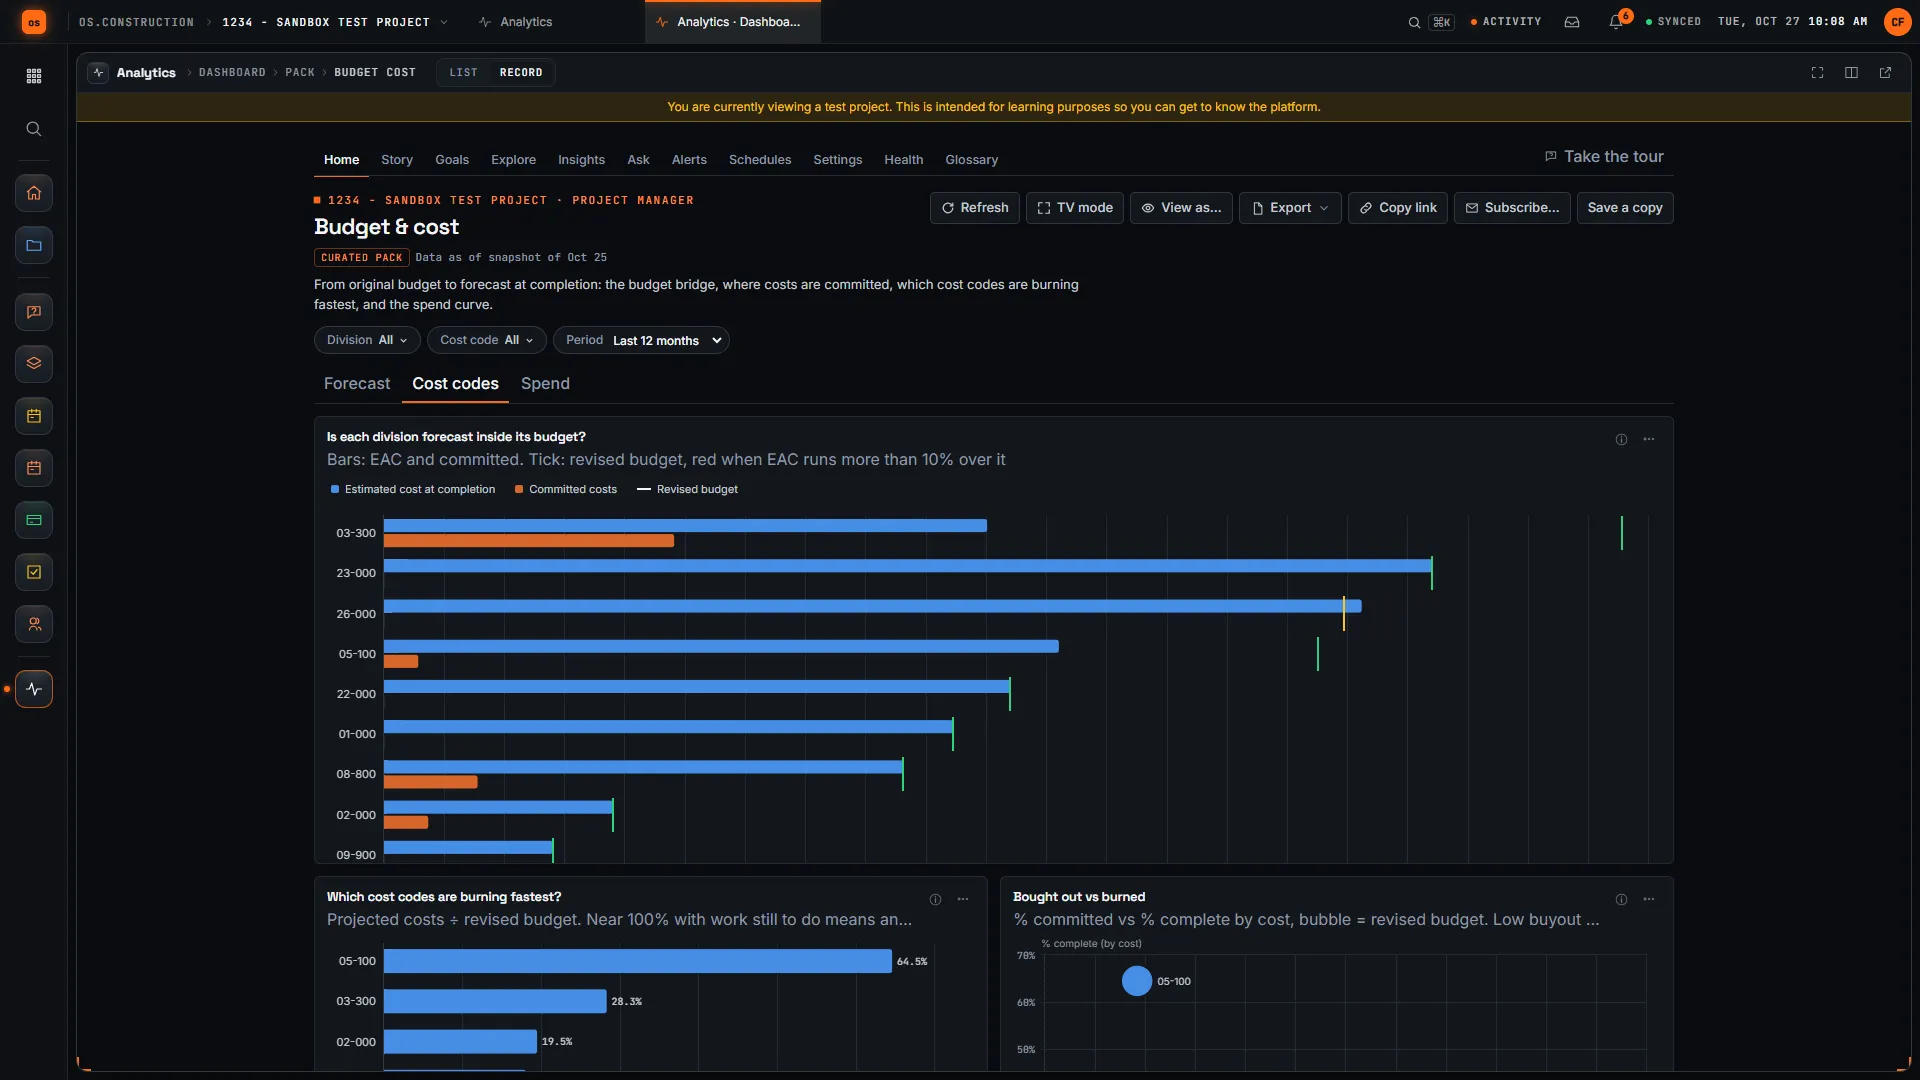
The Cost codes tab answers "is each division forecast inside its budget?": bars for EAC and committed, a tick for the revised budget that turns red when EAC runs more than 10% over, then which cost codes are burning fastest and bought out vs burned.
Beyond the pack
Packs are read-only; Save a copy to change one. Export downloads CSV, XLSX or a PDF, Subscribe… schedules it to recipients who each get their own render, and TV mode runs it full screen. Every tile still follows each viewer's permissions in each tool. Analytics is in preview; cash forecasting is planned.
Every tile, as a table
| Tile | Value | How it's calculated |
|---|---|---|
| Revised budget | $43,500,000 | $42,640,000 original + $860,000 approved changes = $43,500,000 |
| Projected costs | $38,950,000 | $36,800,000 committed + $1,650,000 direct + $500,000 pending = $38,950,000 |
| Forecast to complete | $4,729,800 | Manual FTC entered by the PM: $4,729,800 |
| Estimated cost at completion | $43,679,800 | $38,950,000 + $4,729,800 = $43,679,800 |
| Forecast over/under | +$120,200 | $43,800,000 projected budget − $43,679,800 = +$120,200 |
| % committed | 84.6% | $36,800,000 ÷ $43,500,000 = 84.6% |
| Desktop margin | $5,620,200 | $49,300,000 contract − $43,679,800 = $5,620,200 (11.4%) |
Keep going
Keep exploring
Related across os.construction
- BlogWIP shouldn't be a month-end projectThe work-in-progress schedule is the most important report a contractor produces, and most build it from four sources a week after the month closes. Here's the math, what over and under billing really tell you, and why WIP should be live.
- DocsJob cost and WIPReview job cost forecasts, then compute, approve and post the WIP schedule.
- DocsPayment applications: G702/G703 progress billingCreate a pay app against a prime contract, subcontract or purchase order. Enter this period's progress on the G703, check the G702, then submit and approve.
- BlogOver billing vs under billing: what your WIP is telling youOver and under billing aren't good or bad on their own. They're symptoms. Here's how to read each one, the questions that separate a billing problem from an estimate problem, and the checks a surety will run before you do.
- GlossaryAccrualRecording a cost (or revenue) in the period it was incurred or earned, even if the invoice hasn't arrived or the cash hasn't moved.
- GlossaryWIP scheduleA monthly report that compares each open job's earned revenue to its billings to show over billing, under billing and projected profit.
Sample project included
Try this workflow on the sample project
Every trial workspace includes a sample project with sample data, so you can follow these steps in the app before touching a live job.
Want this on live job data?
The project desktop and Analytics (in preview) are live in os.construction, built from the same records as the Budget tool. Cash forecasting remains planned; company Accounting covers the ledger, AP, AR and payroll.
14-day free trial. Pricing for paid plans isn't set yet. Talk to us. Already have an account? Sign in →
All figures are illustrative sample data, not a real project. Contract terms and state law decide how retainage, stored materials and change orders work on your job. Check both.